How California’s New Health Equity Metric Works
October 6, 2020 at 8:20 pm
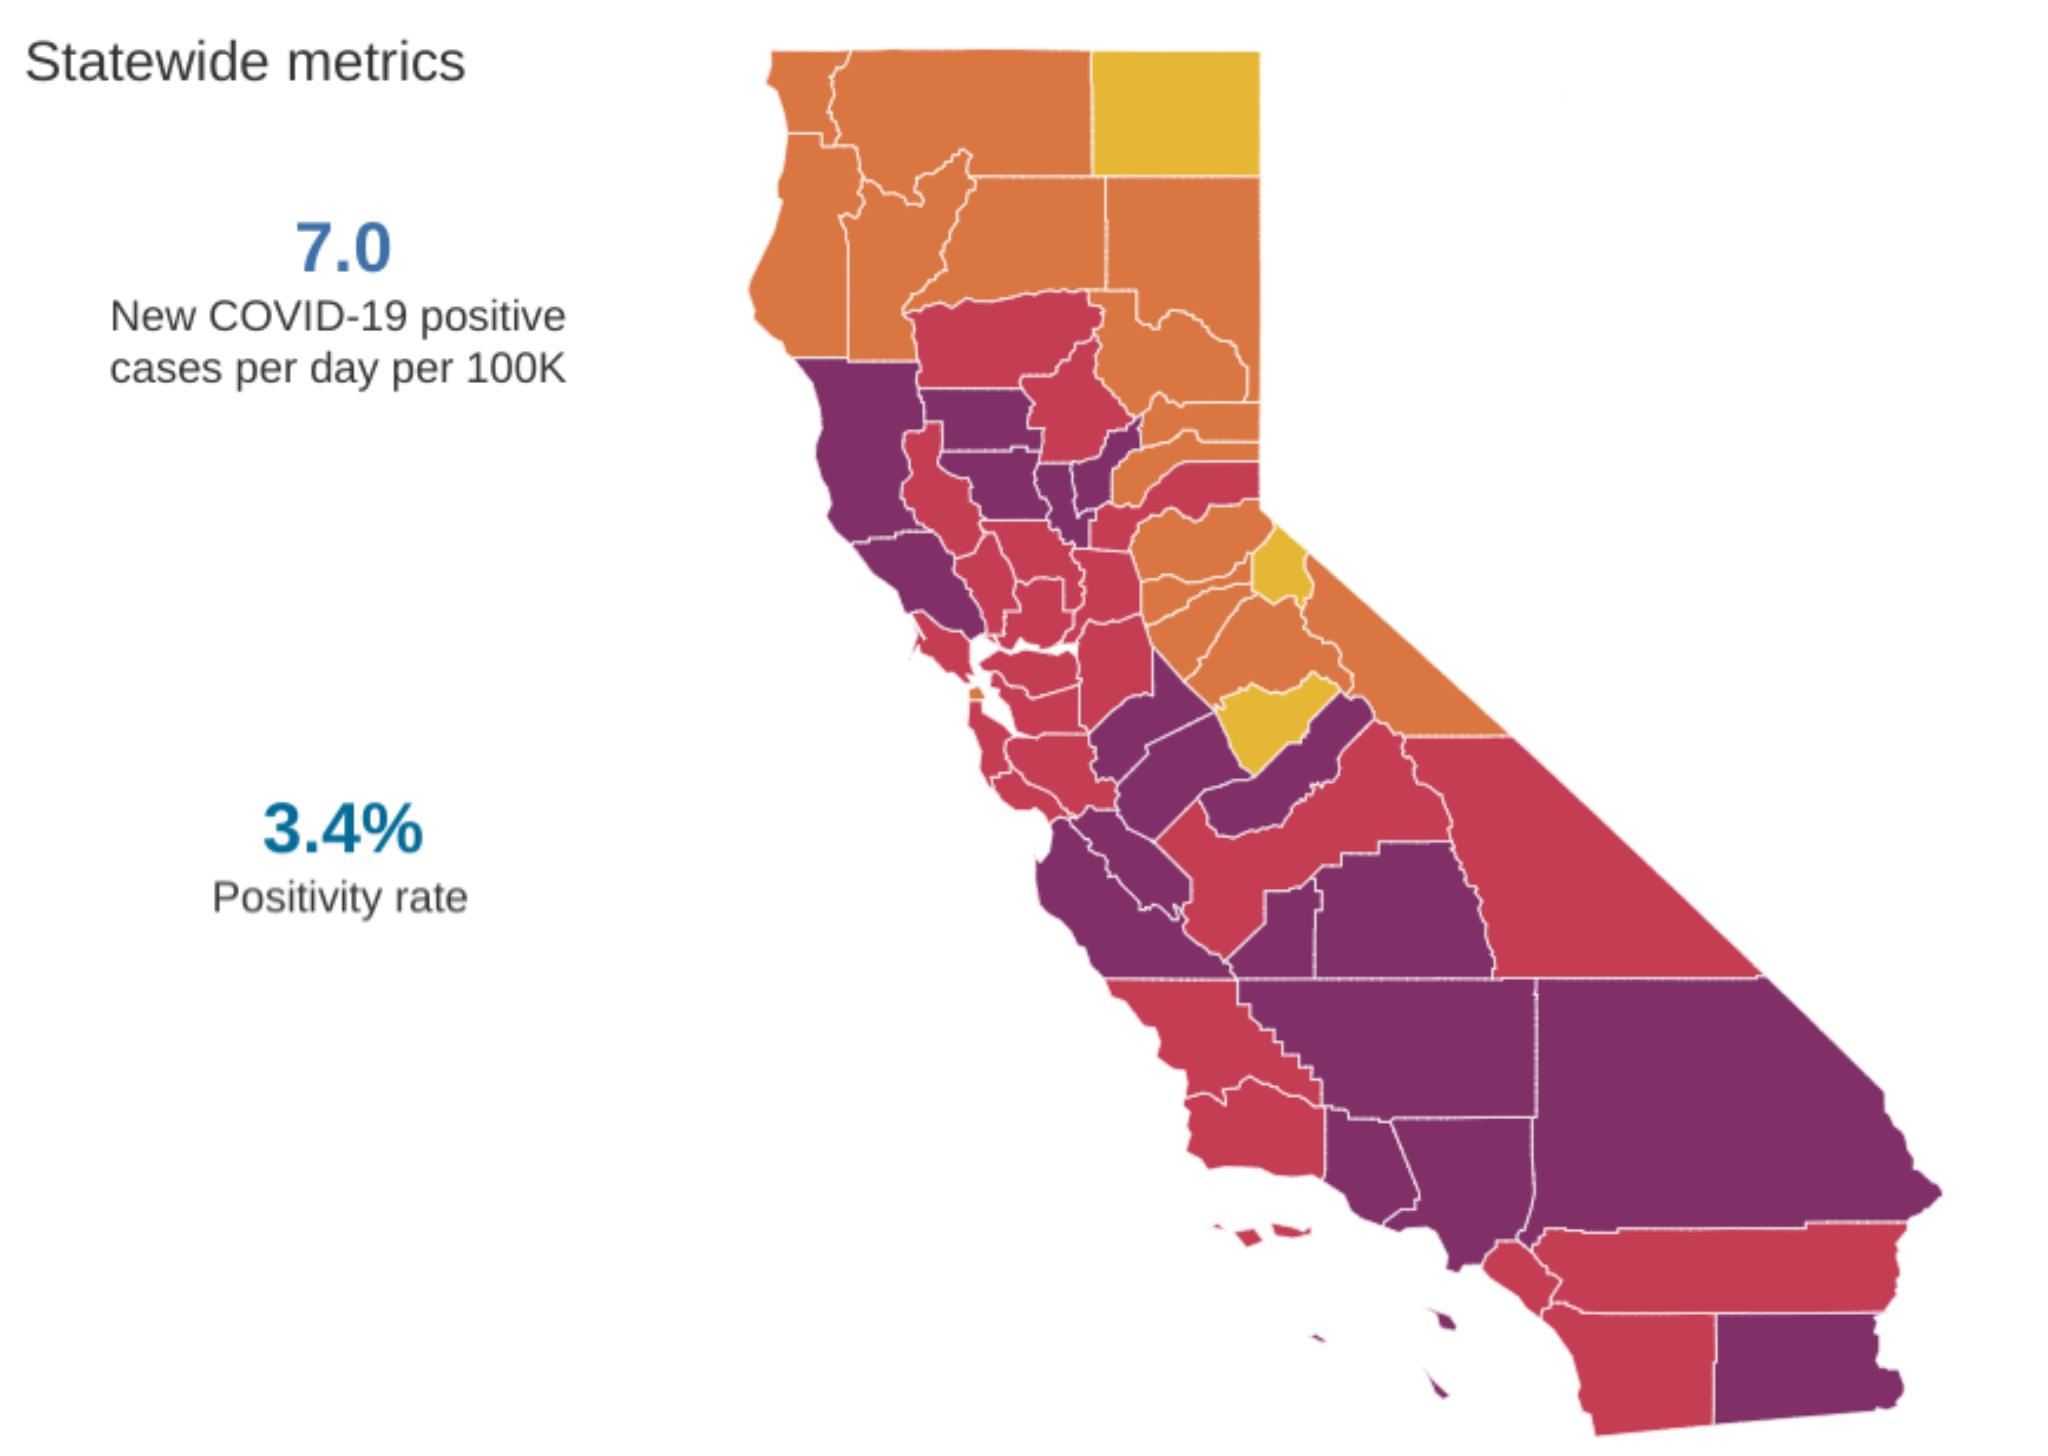
The California health equity metric, a new requirement for counties to advance to less restrictive levels in the state’s tiered coronavirus monitoring system, came into effect this week. The metric is based off of the Healthy Places Index (HPI) calculated by the Public Health Alliance of Southern California. The alliance is composed of the local health departments for Long Beach, Pasadena, and Imperial, Los Angeles, Riverside, Santa Barbara, San Bernardino, San Diego, and Ventura Counties, accounting for roughly half of California’s population.
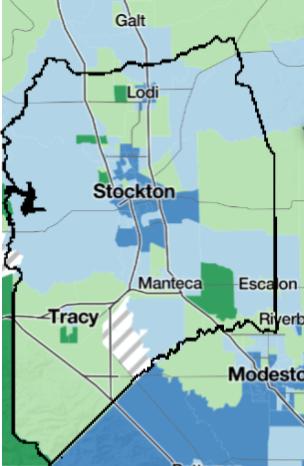
Map of census tiers in San Joaquin County by their Healthy Places Index. Neighborhoods in the bottom 25% are in dark blue, with the neighborhoods in the top 25% in dark green.
The HPI is a composite score calculated for every census tract (neighborhood) in the state based on 25 characteristics. Each county then determines which neighborhoods fall within the bottom 25% of its scores. The positive coronavirus test rate for individuals living in those areas, the health equity metric, must be below a certain percentage in order for a county to move to a less restrictive tier.
For example, San Joaquin County’s positivity rate for the bottom 25% of HPI neighborhoods is roughly 5.7%. That percentage must be at 5.2% for at least two weeks to move to orange, the next tier. However, the health equity metric cannot be used to move a county back to a more restrictive tier.
The 25 characteristics to calculate HPI are separated into eight groups, weighted as follows:
Economic (32%)
• Percentage of population with an income exceeding 200% of the federal poverty level
• Employment rate for those aged 25 to 64
• Median household income
Social (10%)
• Percentage of children in a two-parent household
• Voter turnout in the 2012 general election
Education (19%)
• Percentage of 3 and 4 year olds in school
• Percentage of 15-17 year olds in high school
• Percentage of population over 25 with a bachelor’s degree or higher
Transportation (16%)
• Percentage of households with access to a car
• Percentage of those 16 and older who commute to work by walking, biking, or taking public transport
Neighborhood (8%)
• Number of retail, entertainment, and education jobs per acre
• Percentage of population living within half a mile of an open space larger than 1 acre
• Percentage of land with tree canopy
• Percentage of people in urban areas who live less than half a mile from a supermarket (or less than 10 miles in rural areas)
• Percentage of people who live more than a quarter mile from a store that sells alcohol
Housing (5%)
• Percentage of low-income renter households who spend more than 50% of their income on housing
• Percentage of low-income homeowner households who spend more than 50% of their income on housing
• Percentage of households living with basic plumbing and kitchen facilities
• Percentage of households with one or more rooms per person
Clean environment (5%)
• Average amount of ozone (smog) in the air during the most polluted 8 hours of summer days
• Average yearly concentration of PM 2.5 particles
• Concentration of diesel emissions
• Drinking water contaminant index
Healthcare (5%)
• Percentage of those aged 18 to 64 currently insured